

ManageEngine Applications Manager 9
Last update:
Tue, 28 December 2010, 10:00:05 pm
Submission date:
Mon, 2 February 2009, 12:50:53 pm
Vote for this product
ManageEngine Applications Manager description
Monitor Performance of Apps, Servers, DB, Systems, Websites, SAP, JMX/SNMP Consoles
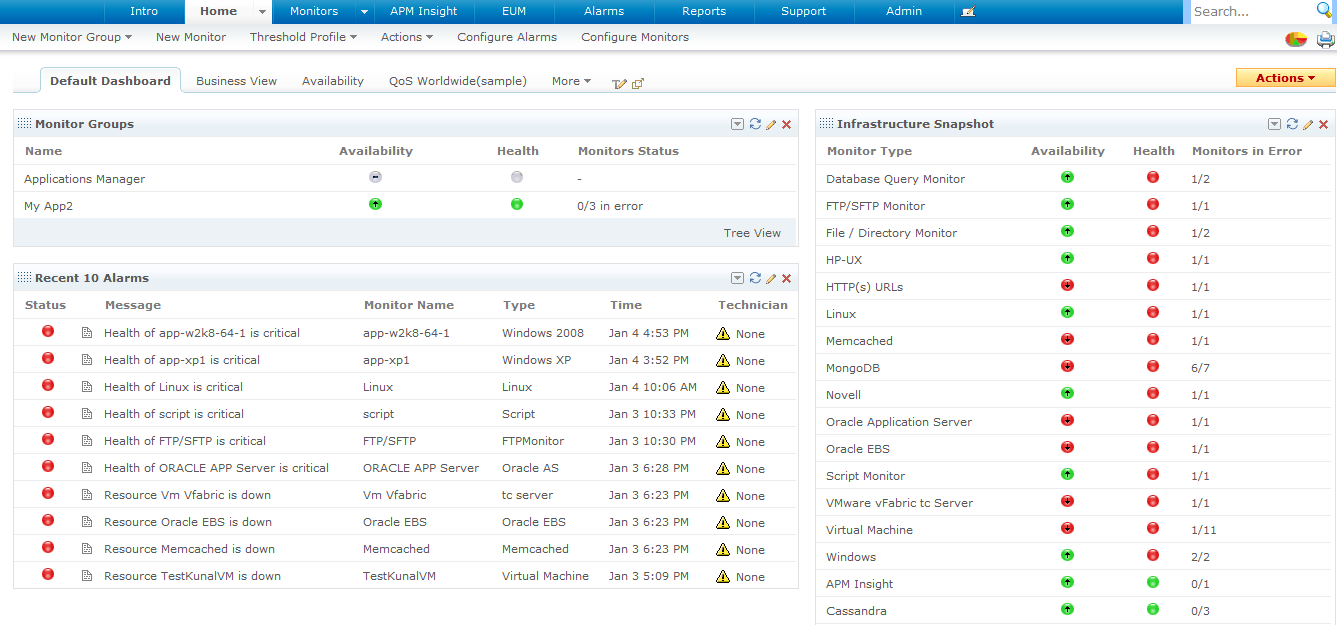
Applications Manager offers a single integrated monitoring tool suitable for application monitoring, database monitoring, system monitoring, website monitoring, services monitoring, and custom application monitoring. Applications Manager proactively monitors applications and servers and notifies problems in network through e-mail/SMS. It provides graphs and reports that display performance and availability data of the monitors. Application monitoring helps you achieve higher availability and optimized performance of your application servers through Microsoft .NET Monitoring, Oracle Application Server, JBoss Monitoring, Tomcat Monitoring, WebLogic Monitoring, WebLogic Integration Monitoring, WebSphere Monitoring, J2EE Web Transactions and Java Runtime. Database Management feature accelerates the detection, diagnosis, and resolution of business-critical database performance issues before they affect end-users. It notifies DBAs and Operators of database problems even before they could interrupt business availability. The databases that are supported are MySQL, Oracle, SQL Server, Sybase, PostgreSQL, memcached and DB2. Server Monitoring involves monitoring of Windows, Linux, HP-Unix, Tru64 Unix, Solaris, FreeBSD, IBM AIX, Mac OS and Novell systems. SAP performance can be monitored by the SAP Module. Website monitoring involves URL Monitoring , URL Sequence Monitoring, URL Content Monitoring and end-user experience monitoring. Virtualization monitoring involves monitoring of VMware ESX/ESXi servers and their guest virtual machines. Cloud monitoring involves monitoring Amazon EC2 and RDS instances and the apps running in these instances. Services Monitoring feature monitors the health and availability of the following services : JMX applications, Microsoft Exchange Server, Service Monitoring (any TCP/IP port),SNMP Agent,Web Server (Apache & IIS).Custom Monitors enables you to create JMX consoles and SNMP Consoles and to monitor your Java applications or other applications that expose management information through SNMP & JMX. It enables SLA management by tracking SLAs. Further, the business views are empowered by integrating Applications Manager with Google Maps. Requirements: 1.4Ghz, 2GB RAM, 20GB HDD Tags:
Applications Management
Server Monitoring
Database Monitoring
System Monitoring
Service Monitoring
Website Monitoring
Virtualization monitoring
VMware monitoring
cloud monitoring
JMX/SNMP Consoles
SAP
SAPCCMS
AS400 Monitoring
iseries Monitoring
Business Service Management
weblogic
websphere
jboss
Amazon EC2
Amazon RDS
microsoft .net
active directory
database query monitoring
windows
linux
solaris
hp-ux
freebsd
apache
tomcat
Comments (0)
FAQs (0)
History
Promote
Author
Analytics
Videos (0)
Share this page


• Audio (646)
• Business & Finance (2483) • Desktop Enhancements (296) • Games (392) • Home & Education (770) • Networks & Internet (1298) • Multimedia & Design (556) • Software Development (314) • Utilities (8230) • Web Authoring (255) • eBooks (5) • Graphics (580) Translate with Google


Related downloads
• dbForge Data Compare for SQL Server 5.1
SQL Server data compare tool • dbForge Data Pump for SQL Server 1.6.52 SSMS add-in for data export and import • dbForge Event Profiler for SQL Server 1.6.57 Free tool for analyzing SQL Server Events • dbForge Index Manager for SQL Server 1.11.46 dbForge Index Manager for SQL Server • dbForge Schema Compare for SQL Server 5.1.71 Database schema compare tool for SQL Server • dbForge Source Control for SQL Server 2.3.47 SSMS add-in for source-controlling databases • dbForge Search for SQL Server 2.5.42 Free SSMS add-in for searching SQL objects • CSV Editor Pro 21.0 A powerful tool for working with CSV files. • RazorSQL 9.4.4 SQL database query tool, browser, and editor. • RazorSQL 9.4.4 SQL database query tool, browser, and editor. More >>> Top downloads in this category
1. FlowHeater 4.2.4
Downloads: 771 2. RazorSQL 9.4.4 Downloads: 690 3. RazorSQL 9.4.4 Downloads: 689 4. RazorSQL 9.4.4 Downloads: 614 5. Query Tool (using ODBC) 7.0 x64 Edition 7.0.4.62 Downloads: 594 6. dbForge Search for SQL Server 2.5.42 Downloads: 584 7. dbForge Event Profiler for SQL Server 1.6.57 Downloads: 571 8. CSV Editor Pro 21.0 Downloads: 562 9. dbForge Schema Compare for SQL Server 5.1.71 Downloads: 532 10. Universal SQL Editor 1.9.2.3 Downloads: 529 More >>> |
Contact Us | Submit Software | Link to Us | Terms Of Service | Privacy Policy |
Editor Login
InfraDrive Tufoxy.com | hunt your software everywhere.
© 2008 - 2026 InfraDrive, Inc. All Rights Reserved
InfraDrive Tufoxy.com | hunt your software everywhere.
© 2008 - 2026 InfraDrive, Inc. All Rights Reserved